
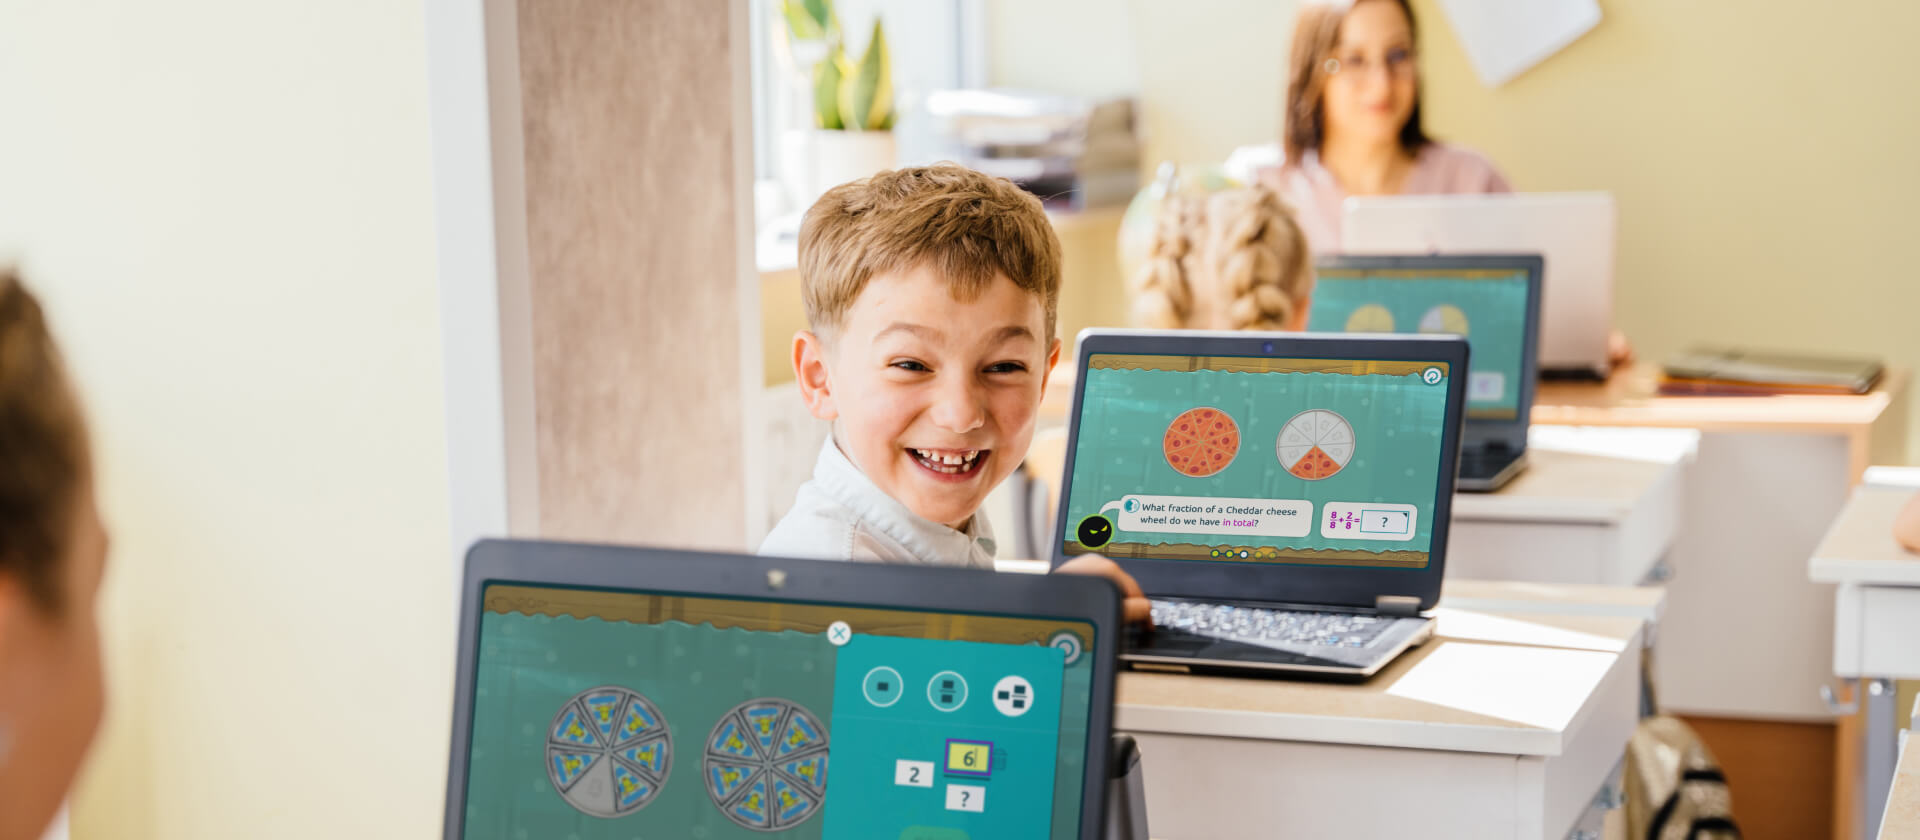
Conducted across eight Australian primary schools, this study measured student maths performance before and after using Matific in the classroom and at home. Students showed an average 34% improvement in test scores, with teachers reporting higher engagement in problem-solving and a deeper understanding of maths concepts. The research concluded that Matific supports conceptual understanding and boosts student outcomes in a short time frame.


Improved Student Learning Outcomes

34% Boost in Test Scores in Just One Term
Source: Attard, C. – Western Sydney University [View Full Study]

Three Months of Extra Learning in One School Year
A large-scale study by SEG Measurement followed nearly 1,500 primary school students over a full academic year. The results were clear: students using Matific consistently outperformed those who didn’t, showing faster progress, stronger skills, and greater confidence in maths.
For younger learners, the benefits were even greater — giving them a valuable head start in mastering key concepts. Importantly, the positive effects were consistent across all backgrounds, showing that Matific works for every child.
Source: SEG Measurement [View Full Study]

Large Effect Sizes (0.33–0.76 SD) in Maths Achievement
In Uruguay’s national High Touch High Tech (HTHT) pilot, an independent study of more than 2,700 fifth graders found that students using Matific achieved much greater gains in maths than those who didn’t. On average, children who used Matific learned significantly more than their peers — progressing the equivalent of several extra months of maths in just one school year. Those who used Matific most regularly made the largest gains, advancing more than twice as much as students in traditional classrooms.
Beyond higher test scores, students developed greater perseverance, confidence, and independent learning skills. Teachers reported that Matific kept learners highly engaged and fostered more positive attitudes towards mathematics, setting the stage for lasting success.
Source: Education Commission Asia [View Full Study]

Early Learners Show Significant Gains in Only Four Weeks
UAE Preschool Study (2024)
A study of preschoolers in the UAE’s Al Dhafra Region revealed that all students showed significant improvement in foundational math skills (counting, simple addition/subtraction, shapes, patterns, measurement, and problem-solving) after just four weeks of using Matific. Both boys and girls benefitted equally, with no performance differences by gender. The gains were statistically significant, showing clear effectiveness even in very early learners.
Source: Abdul Rahman, 2024 [View Full Study]

Maths Failure Rates Cut by 87% in One Year
An evaluation by Escola Municipal Professor Lázaro Sagrado (Colourado, Brazil) found that introducing Matific into weekly maths lessons led to a dramatic drop in failure rates. Prior to Matific, 31.8% of students from Years 2 to 5 either failed mathematics or required special approval to pass. After one year of using Matific, that figure fell to just 4% — an 87% reduction in students not reaching the required standard.
Compared with other local schools that did not use Matific, the improvement was striking: while many saw little change or even higher failure rates, Matific school results improved across all grades.
Source: Escola Municipal Professor Lázaro Sagrado [View Full Study]

Empowers Teachers & Enhances Instruction

In a major U.S. study, 89% of teachers said they would recommend Matific
In the U.S. SEG study, nearly 9 out of 10 teachers said they would recommend Matific, and 78% planned to keep using it the following year—reflecting strong satisfaction and ongoing commitment.
Source: SEG Measurement [View Full Study]

Matific Helps Teachers Deliver More Effective Maths Instruction
In Uruguay’s national HTHT evaluation of over 2,700 students, teachers who used Matific effectively saw their classes complete 20% more activities and achieve significantly higher learning gains. The study shows Matific is a research-validated partner for teachers, strengthening instruction and boosting classroom impact.
Source: Education Commission Asia [View Full Study]

77% of Teachers Said It Improved Lesson Clarity
An independent study found that Matific helps teachers present maths concepts more clearly and make lessons more relevant to everyday life. Over three-quarters of teachers reported clearer demonstrations of maths concepts (77%), while 82% said it made lessons feel more connected to the real world. Teachers also observed stronger student engagement and more positive attitudes toward maths when using Matific.
Source: Szold Institute [View Full Study]
Boosts Student Engagement & Confidence

Matific Enhances Engagement and Learning in Australia
In a case study spanning 8 primary schools across diverse socio-economic contexts, students using Matific demonstrated meaningful growth: their post-test scores showed an average improvement of 34% on available marks. Educators also reported that Matific made mathematics more engaging - students described the mathematics as “fun” - they genuinely felt they were learning, whilst playing.
Source: Attard, C. – Western Sydney University [View Full Study]

Matific Rated #1 for Student Enjoyment in South Africa
In a national implementation across 328 schools, the Click Learning Program found that 78% of students enjoyed learning with Matific — the highest rating among three numeracy tools evaluated. Teachers highlighted Matific’s game-like design, instant feedback, and support for mental maths as key drivers of engagement.
Source: Double Click Qualitative Report (2024) [View Full Study]

95% of Students Felt More Engaged
According to the Szold Institute, classrooms using Matific saw 95% of students more engaged, with teachers reporting major increases in curiosity (84%) and enjoyment (98%). Educators also noted that Matific made lessons clearer and more relevant to students’ lives.
Source: Szold Institute [View Full Study]

Matific Strengthens Participation and Understanding
In a pilot project across select Fijian primary schools, Matific’s game-based learning approach led to higher student engagement and better understanding of difficult maths concepts. Teachers reported increased classroom participation and improved student attitudes toward mathematics.
Source: Ravinesh Prasad, Fiji National University [View Full Study]

Students Reported Greater Perseverance and Confidence
Students in high-use groups self-reported greater perseverance (GRIT scores), independent learning, and stronger attitudes toward math. Teachers noted that learners became more willing to tackle challenges and persist through problems — essential skills for long-term success in maths.
Source: ECA / Plan Ceibal [View Full Study]
Pedagogical Design and Quality

Rated “Exemplary” for pedagogy, content, and design
Matific received an“Exemplary” ratingacross all three core categories - Content Quality, Pedagogical Alignment, and Technology & Design - as per the EdTech Tulna framework for Grades 3–5. The evaluation emphasised Matific’s constructivist pedagogy and ability to scaffold learning through adaptive gamebased instruction.
Source: EdTech Tulna Framework, IIT Bombay [View Full Study]


